M
MartinV96
Rising Star
Bronze Level
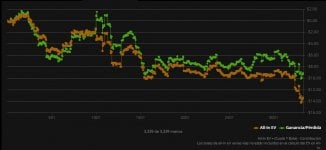
Im making good decisions? Im playing good? expected value graphic?
I've been learning poker and studying it quite recently. Been playing in GGPoker about a month ago. As some of you may know, you can go to PokerCraft where you can watch your analytics and check your EV graphic. Does this tells you if you are playing good?
Because im going through, what i think that is, a losing streak. Im always trying to be objective when im making right or wrong decisions. But this weeks ive been getting some coolers, bad beats, bad luck (i believe)
Tell me if I'm wrong, but from what I understand, as long as the green line is equal to or above the orange line, it means that you are making good decisions for what you are expected to generate value.
The thing is that as a new poker player, it is logical and reasonable that the doubt comes to mind: how long can it be a bad streak? Could it be that there is something I'm not seeing and I think I'm making good decisions overall? Could it be that it's just a bad streak and that I should continue adding volume? I want to leave you my expected value graph so that it may help you resolve my question.
I also attach what appears to me regarding luck in case it helps.


