Any 2/3 or 1/3 grinders out there? How is your graph looking?

Aaron Soto

Aaron Soto

Rock Star
Silver Level
Joined
Apr 21, 2015
Total posts
305
Chips
0
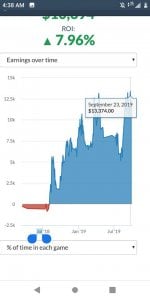
I have some questions for players who play the same limit i play. I'm a 40-50 hour per week grinder who plays 2/3 live 100-300 buy in. Typical day for me is play with 3 buy-ins per day. I'm wondering if players out there are getting the same results or "Better" results then I am. I'm wondering if there "Poker graph" has a similar look to mine. I consistently go through massive downswings after a month or two then jolt it back up...is this normal? I'm currently in one of the sickest swings - break even months I been in....I'm about a 4bb per hour winner according to my graph. Nothing special obviously. I wish i was averaging 10bb per hour.
 

Attachments

  • graph.jpg
    graph.jpg
    31.2 KB · Views: 14
C

c0rnBr34d

Visionary
Silver Level
Joined
May 6, 2019
Total posts
991
Chips
1
I play some similar levels but not nearly as many hours. I'm getting about 50 hours a month these days instead of the 40-50 per week you play. That said I had my most significant downswing since I started tracking in 2014 starting in June. The original App I used doesn't do graphs so I only have a graph from 2018 forward. Last year was my best tracked year at 15.59 BB / hr over a mix of 1/2, 1/3, and mostly 2/5. The whole year was only 250 hours however so the data doesn't really mean anything. This year after the huge downswing I'm at 4.5 BB / hr over 365 hrs. If I combine the two years of data in the new app I'm at 9.92 BB / hr over 641 hrs. When it gets to 1,000 hours I guess I'll start to have a feel if these numbers are somewhat meaningful. I've seen some graphs from other players on other forums that are smoother so perhaps we both need to examine our games and figure out how to limit the downswings that have to come from time to time. Getting back to basics, increasing focus, and taking notes on problem hands have all been given as advice that I try to follow.
 
Top