You are using an out of date browser. It may not display this or other websites correctly.
You should upgrade or use an alternative browser.
You should upgrade or use an alternative browser.
Stick66
Legend
Silver Level
Hmmm, no response. Seems I've stumped the place. Judging by the silence, I guess the answer is "no". I guess I'll have to answer my own question.Can anyone here make anything out of it?
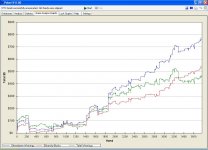
I did some research and it seems this can be used to determine a player's "luck factor". If the blue line is above the red line, then that means the player is running "good". Blue below red means running "bad". I'm not sure, but I think the green line is all winnings including folds & non-showdown wins. I still haven't found out exactly what "Sklansky bucks" are. I guess I'll keep hunting.
ChuckTs
Legend
Silver Level
Well I'm confused at what showdown winnings are, and what total winnings are. Are they not both just 'actual' winnings?
Sklansky bucks, I would assume, would be the expected value from your hands, hence it being used as a guideline for the player's 'running good'...ness...
Sklansky bucks, I would assume, would be the expected value from your hands, hence it being used as a guideline for the player's 'running good'...ness...
Flops'm&Bets'm
Rock Star
Silver Level
My take on it would be the Sklansky's Bucks would be the EV of the Hands that are of starting value and the % of times they pay-out.
In a comparison to the players value out of the hands that rate as Sklansky's combination of "Valued Hands" entered into the data base as the 'Line' of comparative. Suited connectors and AA,KK,A-K,QQ,A-Q etc.
through on down to PP and gapper hands. K-J, Q-10
The Green line is the above or below what the actual hand played for and at what EV it finished for the 'Value'
It looks to me like a starting for bankroll Progress,
On the other hand it seems like a MTT graduation Graph of chip values as the Blinds increase.
As the Graph is showing the # of Hands Played and the # of Hands omitted. Seems odd that 260 hands were skipped out of 3600+.
If this is a progressive analysis and the players Bankroll is increased by leaps as the # of hands increases, given wins and losses through the drops and peaks.
Hope this gives some clues to make sense of it, or helps to have different 'take' on it.
Other than that I rally can't say what it represents since I cannot use the said program, to understand it more.
And figure out what the purpose serves. A Sklansky HH translator similar to Poker tracker in a Play by Play of one's Total HH in motion..(as per the Play button on the top??)
Have you Queried the source?? Good Luck on the answer~ Ask Isaac Isomov! LOL~
Last edited:
Stick66
Legend
Silver Level
The 2+2 Forums: Sklansky Bucks Calculator: PokerEVEV vs. how much you actually win.
I want this program
Flops'm&Bets'm
Rock Star
Silver Level
From what I've read in that re-direct.
I was close!
But the person obviously have landed in the right ballpark for what Players need to assess their play, and a replay feature seems cool too.
Any Beta testers are going to benefit once they get the swing of the software, and apply the learning curves that will show the 'leaks'.
Great Post Mr.Stick!!
+rep for the HU!!