What does this mean??

P

Potheadwoman

Enthusiast
Silver Level
Joined
Jan 25, 2011
Total posts
67
Chips
0
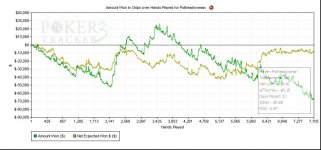
I have spent alot of timing studying equity(icm) and beginning to learn more about push/fold ranges and calls in late 3.30 10 handed turbo games. I use pt3 and I now have around 8,000 hands tracked. I currently have a 4% ROI for the month with about 150 games played. I am currently pleased with my results but looking at my win amount $$ vs my net EV Won$$ in pt3 on a graph it shows from hand 5,655 - 7705 my net expected win $$ is much higher then my actually win amount $$. The graph is measured in chips and I would say on an average estimate there is a 30k-50k difference in this measure. I am curious as to what this means. If I were to take a shot in the dark it means I am having a downswing in variance ie Im losing hands to hands I shouldn't lose over an average time. Or Im thinking I have improved my game but I am lacking somewhere (even though I have improved) and im losing because of an undeveloped skill(perhaps ranging villians correctly). Amount Won in Chips over Hands Played for Potheadwoman
 
P

Potheadwoman

Enthusiast
Silver Level
Joined
Jan 25, 2011
Total posts
67
Chips
0
Lol just curious as to why nobody responds to any of my posts?
 
Swear Engine

Swear Engine

Rock Star
Silver Level
Joined
Apr 28, 2009
Total posts
387
Awards
1
Chips
4
I don't use PT or anything like that and i'm no expert in reading graphs but doesn't this graph show you down like $60-70k?
 
P

Potheadwoman

Enthusiast
Silver Level
Joined
Jan 25, 2011
Total posts
67
Chips
0
Its showing me down 50,000 chips which is roughly 33.333 buy ins or 110 dollars in buy ins. But Im really up for the month and down last month. So I dunno im very curious lol
 
Worak

Worak

Legend
Bronze Level
Joined
Oct 25, 2008
Total posts
6,024
Chips
0
I think you're right about your downswing as you said but as you can see you were running rather good before that.

The second point you made is probably true for almost everyone - there's always room for improvement.
 
Swear Engine

Swear Engine

Rock Star
Silver Level
Joined
Apr 28, 2009
Total posts
387
Awards
1
Chips
4
Ah okay. You really need some of the other PT users to help you analyse your graph. It's all double dutch to me.:eek: :)
 
P

Potheadwoman

Enthusiast
Silver Level
Joined
Jan 25, 2011
Total posts
67
Chips
0
Thanks guys!! A little bit of help is better then no help!!
 
TylerN

TylerN

Kool-Aid & Frozen Pizza
Silver Level
Joined
Aug 2, 2009
Total posts
3,728
Chips
0
you were running great and now your running bad
 
bonflizubi

bonflizubi

Visionary
Silver Level
Joined
Jul 7, 2008
Total posts
575
Chips
0
that graph is useless IMO.

If you are Push folding right, then you are going to have a negative expectation a lot of the time- WHEN you are called.

It doesn't factor all the folds you get or calculate the EV of a push - at the point you push it.
 
Poker Orifice

Poker Orifice

Fully Tilted
Platinum Level
Joined
Jan 19, 2008
Total posts
25,769
Awards
6
CA
Chips
1,023
that graph is useless IMO.

If you are Push folding right, then you are going to have a negative expectation a lot of the time- WHEN you are called.

It doesn't factor all the folds you get or calculate the EV of a push - at the point you push it.

agree 100% (wow.. how weird... I actually agree... )
 
BigJamo

BigJamo

Aussie Elite
Silver Level
Joined
Aug 9, 2010
Total posts
2,088
Chips
0
LOL, I would love to respond to your ???

But, to tell you the truth, I dont have a tracker, so i dont have any experience with them, yet, but, I thought I would respond anyway.

It looks like to me that your running fine, a little change in your range, push/fold, and your downswing will turn around.

Dont get your head cluttered with graphs, just play your own game, and the swing will go the other way. If anything, the graph you have there is showing a speady rise, before the downslide, so keep up the good work.
 
dj11

dj11

Legend
Silver Level
Joined
Oct 9, 2006
Total posts
23,189
Awards
9
Chips
0
Over this range of hands, you first won less than expected, then more than expected, and now way less than expected.

It is a tricky graph, and sort of looks like you would be down a ton. But I think the thing is that you are comparing pickles to cucumbers.....:confused:
 
W

WiZZiM

Legend
Silver Level
Joined
Oct 28, 2009
Total posts
5,008
Chips
0
It doesn't mean anything. Your much better off focusing on the hands you play, rather than pointless graphs about results that don't matter.
 
JohnBoyWWFC

JohnBoyWWFC

Grindddddd
Silver Level
Joined
Jan 11, 2010
Total posts
5,369
Chips
0
Also only 150 tourneys you said? Play more it'll level out. I don't know how reliable ev graphs are for S&Gs though tbh.
 
W

WiZZiM

Legend
Silver Level
Joined
Oct 28, 2009
Total posts
5,008
Chips
0
Also only 150 tourneys you said? Play more it'll level out. I don't know how reliable ev graphs are for S&Gs though tbh.

Not very. Most of them use some form of ICM, so it inherits all of ICM's shortcomings.
 
P

Potheadwoman

Enthusiast
Silver Level
Joined
Jan 25, 2011
Total posts
67
Chips
0
Hey thanks everyone for the responses. I didnt think it meant anything significant but I was just curious if there was an estimated meaning to it. If you look at the graph though you can can see a sharp incline. I think thats exactly where I picked up basic strag. for STT from Moshman. Of course this is in chips earned. So what I think its begining to mean is I am putting myself ITM more often then before but am not getting as many first place finishs. If I have 8500 chips heads up and the villian has the rest and he takes them all thats a loss of 8500 chips. So I dont think this graph is a good indicator of profit/loss.
 
DaveE

DaveE

Solvem probler
Project Moderator
Joined
Mar 8, 2007
Total posts
14,363
Awards
23
CA
Chips
932
Are you familiar with sharkscope? Looking yourself up every once in a while will help in tracking your overall progress.
 
PurgatoryD

PurgatoryD

Visionary
Silver Level
Joined
Aug 9, 2008
Total posts
736
Chips
0
"Net Expected Won"? Sorry, I just can't seem to get my head around that one.
 
P

Potheadwoman

Enthusiast
Silver Level
Joined
Jan 25, 2011
Total posts
67
Chips
0
hah It is rather ammusing right
 
bonflizubi

bonflizubi

Visionary
Silver Level
Joined
Jul 7, 2008
Total posts
575
Chips
0
This graph is only useful fro cash play and has no application for tourney play. I wish that PT 3 did not include it for tourneys at all as it's misleading and I've told their developers that. One must remember that PT and HEM were developed from cash mindsets initially way back when, and tournament application has slowly spun out of that.

"Net Expected Won"? Sorry, I just can't seem to get my head around that one.

Net expectation here makes a ton of sense for cash game application and is useful for cash players. It looks at your EV in the hand at the moment the money went in. Cash games are all about ev and ev only, so they want to see a graph that shows you getting the money in good (and hence a positive net expectation)

Though, even for cash players this ignores the EV gained from folding people out when a shove is a bluff or semibluff and you get them to fold.

Not very. Most of them use some form of ICM, so it inherits all of ICM's shortcomings.

That graph has NO ICM In it at all.


I get a lot of interaction with the PT3 developers and have laid out at least a page long essay on what kinds of graphs tournament players need, and this certainly is not it. (I'm one of the people that tests their pre-release software so I see all of it before you guys and tend to give them a lot of input and guidance on how MTT/STT players see things.)

Until they completely revamp the tournament graph system, I'd recommend that no one ever analyze their STT/MTT play with this chart as it will bring you to the wrong conclusions. Often good shoves will be -EV if called- remember, shove ranges are calc'd by including the value of getting folds...

This thread should be locked. There's not much to debate here.
 
PurgatoryD

PurgatoryD

Visionary
Silver Level
Joined
Aug 9, 2008
Total posts
736
Chips
0
It looks at your EV in the hand at the moment the money went in.

OK, thanks for the explanation.

For the reasons you mentioned, this is not very useful for a MTT. However, in just trying to understand the graph at all, I noticed at the tail, her Net Expected Won was about $-10K but her Amount Won was $-70K. Does that mean that she suffered from some really bad beats after betting, or does it mean that Amount Won also contains other factors that Net Expected Won does not contain? In other words, if she got "fair" cards after betting, should her Amount Won also come out to around $-10K?

Thanks.
 
bonflizubi

bonflizubi

Visionary
Silver Level
Joined
Jul 7, 2008
Total posts
575
Chips
0
OK, thanks for the explanation.

For the reasons you mentioned, this is not very useful for a MTT. However, in just trying to understand the graph at all, I noticed at the tail, her Net Expected Won was about $-10K but her Amount Won was $-70K. Does that mean that she suffered from some really bad beats after betting, or does it mean that Amount Won also contains other factors that Net Expected Won does not contain? In other words, if she got "fair" cards after betting, should her Amount Won also come out to around $-10K?

Thanks.

It means she took some beats.

lets change the example. Let's say her expectation was $80 and her amount won was $20.

Let's also assume that she got allin with AA vs KK (80/20 fav) 10 times for $10 each. This would yield and expectation of $80 (10 times by 80% of $10)

If she ran super bad and won only 2 of those 10 AA KK matchups shed win $20 actual.

That's what that chart is showing. No other factors.

The true likelihood though is that she lost a boatload of beats in that last thousand hands... but they were probably losing flips and losing 60/40s. Also, since that chart counts tourney chips, if she lost real big pots the divergence is obviously greater. (Losing 30bb at 10k/20k blinds will look MUCH bigger than losing 30bb at 100/200 blinds.)
 
dj11

dj11

Legend
Silver Level
Joined
Oct 9, 2006
Total posts
23,189
Awards
9
Chips
0
"Net Expected Won"? Sorry, I just can't seem to get my head around that one.

Yeah, it is odd, if you bet 100, and you are all in against a shorty who only had 80, would that produce a -20 result?
 
PurgatoryD

PurgatoryD

Visionary
Silver Level
Joined
Aug 9, 2008
Total posts
736
Chips
0
That's what that chart is showing. No other factors.

OK, thanks. So I can see how the Net Expected Won is far more important in evaluating play than Amount Won. If she went by Amount Won, she would see a drop from +20K to $-70K and think that her play has gotten worse. However, in reality, her Net Expected Won has recently increased from $-40K to $-10K. That variance is pretty amazing. Dang bad beats.

Thanks again!
 
PurgatoryD

PurgatoryD

Visionary
Silver Level
Joined
Aug 9, 2008
Total posts
736
Chips
0
Yeah, it is odd, if you bet 100, and you are all in against a shorty who only had 80, would that produce a -20 result?

No, if you bet 100 and went head to head against an all-in who had only 80, then you are only putting 80 at risk. With that 80, let's say your hand is a 75% favorite. Your expected value from that bet is thus:

.75 * 80 + .25 * (-80) = 40

So you would get 40 added to your Net Expected Won no matter what the outcome of the hand. Then if you actually win, you get 80 added to your Amount Won, and if you lose, you get 80 subtracted from your Amount Won.

At least that's how I now understand it to work. The key is that Net Expected Won is taking away the variance that exists in Amount Won and is just tracking how good (or bad) your plays are.
 
Top