F
facetusmalum
Rising Star
Bronze Level
Hi,
I've put together variance simulators for[dead link~tb] and [dead link~tb] SNGs.
Fifty50 SNGs are a derivative form of the Double or Nothing format, but instead of winning "double" the buy-in (minus rake), the remaining 5 players receive a share of the buy-in, plus a certain amount per 100 chips they have left.
[dead link~tb] takes into account the exact values of rake and winnings per 100 chips for every buy-in, and uses statistical data to assign the finishing chip stack. Because it doesn't take into account tilt and other human factors, on non-marginal ITM values there is very little variance and the chart is simply projected income.
Because, for some reason, ratios of rake to buy-in are different from level to level for Fifty50s, this plays a significant role. The same ITM rate can be losing at one level, and winning at another.
The following is a list of all Fifty50 buy-ins with their respective rake percentages and winnings per 100 chips (in % per buy-in), also represented as a chart here:
As you can see, $1.50 and $3.50 games are extremely unprofitable, as you are being charged the most rake per buy-in. It settles at the same rate for $15-$60 games and then drops even further for high stakes. But this is just a side note, something to take into account.
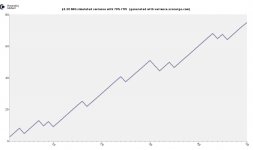
[dead link~tb]is a bit simpler as it only needs to know how often on average does the player finish in the money, and it gives an idea of what variance and ROI might look like on the long run.
The result is a chart of up to 50000 simulated games, with the entered percentage of games won, with the profit/loss displayed in dollars. The results are generated randomly each time, so they would vary slightly between requests.
Feel free to discuss the simulators, and if anything needs to be corrected, I'll gladly do it. Feel free to share it if you find it useful.
Cheers!
I've put together variance simulators for[dead link~tb] and [dead link~tb] SNGs.
Fifty50 SNGs are a derivative form of the Double or Nothing format, but instead of winning "double" the buy-in (minus rake), the remaining 5 players receive a share of the buy-in, plus a certain amount per 100 chips they have left.
[dead link~tb] takes into account the exact values of rake and winnings per 100 chips for every buy-in, and uses statistical data to assign the finishing chip stack. Because it doesn't take into account tilt and other human factors, on non-marginal ITM values there is very little variance and the chart is simply projected income.
Because, for some reason, ratios of rake to buy-in are different from level to level for Fifty50s, this plays a significant role. The same ITM rate can be losing at one level, and winning at another.
The following is a list of all Fifty50 buy-ins with their respective rake percentages and winnings per 100 chips (in % per buy-in), also represented as a chart here:
Code:
Buy-in / Rake   / Win per 100 chips
$1.50  / 11.11% / 2.96%
$3.50  / 6.85%  / 2.85%
$7     / 5.71%  / 3.14%
$15    / 5.67%  / 3.13%
$30    / 5.67%  / 3.13%
$60    / 5.67%  / 3.13%
$100   / 5.1%   / 3.16%
$200 / 4.32% / 3.18%[dead link~tb]is a bit simpler as it only needs to know how often on average does the player finish in the money, and it gives an idea of what variance and ROI might look like on the long run.
The result is a chart of up to 50000 simulated games, with the entered percentage of games won, with the profit/loss displayed in dollars. The results are generated randomly each time, so they would vary slightly between requests.
Feel free to discuss the simulators, and if anything needs to be corrected, I'll gladly do it. Feel free to share it if you find it useful.
Cheers!
Last edited by a moderator: