RoyalFish
Rock Star
Silver Level
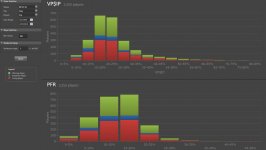
I made this today partly to satisfy my curiousity, partly because, well, I could. The data is taken from 64,000 hands, the bulk of which is 2nl (4,000), 5nl (15,000), and 10nl (45,000). I know, more is better, but hey, that's what I have to work with.
It's a graph of player stats showing what kind of players are at those limits. It's also weighted by number of hands played to account for the fact that if you play one person for 100 hands and another for 1,000, the latter has a greater effect on the kind of person you play against. 10x more often, it's the latter guy. I was a little surprised by the tight cluster around 10/7, and somewhat that so many are 20/10 and less.
I did throw out everyone I have less than 100 hands on, so there's some selection bias going on. The data also doesn't include me. Obviously I have TONS of hands on me, so including me would hopelessly skew the data.
I'd appreciate knowing if anybody else finds this at all interesting. If so, I may post more. If I hear nothing but crickets, I'll take the hint.
RF


")