| This is a discussion on Anyone know how to properly analyze this graph? within the online poker forums, in the General Poker section; Hey guys I started playing poker again after a long layoff. I want to be a better player this time around, so I'm using Pokertracker ... |
| | ||||||
![]() |
| |
|
#1 | ||||
| ||||
| Anyone know how to properly analyze this graph? Hey guys I started playing poker again after a long layoff. I want to be a better player this time around, so I'm using Pokertracker 3 to analyze my game alot more. Any insight as to how I'm playing would be greatly appreciated. 
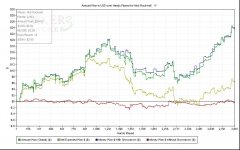
This chart is from November 1st-30th. I played about 23 hours last month at 0.01 / 0.02 and I think I did ok all things considered. Your thoughts? |
| Play Texas Hold'em Online Poker | Anyone know how to properly analyze this graph? | |
|
|
|
#3 | ||||
| ||||
| Quote:
Which stats should I be looking at? |
|
#4 | ||||
| ||||
| nice luck, i would kill for some luck, or just break even between the ev line and green line. see you at the bad beats section when it all comes down crashing with 10 years of storms and lightning and another 2 years of cloudy with occasional showers. other than that, i suggest you don't move up any time soon, spend some time at this level because as i already told you, you are facing some luck, so be careful. other than that, in order to analyze your game we need what you can find under details on poker tracker, and post some hands in our Cash Game Hand Analysis. eat healthy, i would tell you good luck but you already seem to have it. |
|
#5 | ||||
| ||||
| You do seem to be a tad on the lucky side at the moment. Your red line is very good (although at 2NL this might be a sign of overaggression) .. people call too much so you shouldnt be trying to bluff people off hands as much.. which may be whats happening with your AllIn EV. You build big pots trying to bluff and have been getting quite lucky .. meaning thise semi bluffs are turning into the nuts more than is expected. Whats yout total AF, and then AF street by street? If its over 3 its too much! |
|
#6 | ||||
| ||||
| re: Anyone know how to properly analyze this graph? poker Quote:
1st off I'd like to thank you for the quality response. My total AF is 1.90 but I'm not sure how to extract that by street. My W$WSF is 45.62, WTSD is 32.53, W$SD is 53.91 IIRC those aren't too bad, but I probably could play a little tighter. I appreciate the insight from those who know how to accurately read/understand/explain this data. On a side note I do feel like I've been at least a little lucky, but when I get my money in its usually with the better hand... |
|
#7 | ||||
| ||||
| Quote:
If you regurally get all in with the best hand then Allin EV would be around your W$SD (the yellow line is near the blue line) If you reguraly get the money in with a worse hand and draw out then your AllinEV would be much lower than your blue line. (and thats what the graph shows) |
|
#8 | ||||
| ||||
| Quote:
So I guess there's a major correction about to happen. I found the other stats for AF by street, here they are: |
|
#9 | ||||
| ||||
| Oh the other side of the coin of having a wide gap between SD winnings and Allin EV is that you also rarely get outdrawn on. So when you get it in with AA PF you rarely get sucked out on, when in reality a hand like AA should only win around 80% of the time |
|
#10 | ||||
| ||||
| I think your luckk may change. Saying that, those stats look quite good. What stands out is simply how often you check, how little you fold both combined with how often you get to SD. So ... just keep at it, but you should see your winrate drop quite a bit (to a more normal level) and you shouldnt worry you are doing too much wrong if / when it does. |
|
#12 | ||||
| ||||
| re: Anyone know how to properly analyze this graph? poker Quote:
|
|
#13 | ||||
| ||||
| Quote:
By definition, if you play a large number of hands then you dont normally have the nuts. When your red line is shallow (as yours is) this means you are pushing people off a lot of hands.. you win without SD. Which in turn means when they dont fold you cant always have the nuts because to have a shallow red line and a high VPIP you must be pushing people off hands. Like I say it sounds like your luck is going well right now and the times they dont fold you are improving to the nuts quite often (which again corresponds to the low allin ev and high w$SD) BTW dont aim for 17/10 something like 17/15 or 15/12 would be much more profitable. 17/10 is a very passive preflop style. |
|
#15 | ||||
| ||||
| Just thought I'd bump this thread from 10 days ago to give a little report of progress/regression. NL2 is so swingy and there are so many 50/2 or 60/0 players that it makes me not want to play those stakes at all. I've pretty much sustained the large gap between expected won and actual winnings. Im trying to play at the 17/15 clip that Stu suggested and I am not doing bad at the moment. |
|
#17 | ||||
| ||||
| Quote:
Still trending the same way at almost 7k in hands. I need to go back and look at my #'s from 2009 specifically in the few months where I was killing it to see how I was playing at that time. At what # of hands would you say that it would become significant? |
| Similar Threads for: Anyone know how to properly analyze this graph? > Texas Hold'em Poker | ||||
| Thread | Replies | Last Post | Forum | Thread Starter |
| Can someone interpret my graph + stats? | 17 | 27th January 2012 12:29 AM | Learning Poker | ludde2009 |
| My graph looks as though I threw my BR off a cliff. | 23 | 6th January 2012 1:50 PM | Cash Games | pcgnome |
| Using HUD to Analyze Hands and Find My Leaks | 6 | 30th December 2010 7:52 PM | Poker Software & Tools | debpes |
Number of Posts: 17
Number of Authors: 5